The image files needed can be obtained by saving the relevant map as a png from within the VSQL module of VASSAL
I suppose the ultimate aim of all this would be a robot vision system, AI and robot arm which can 'see' the board, generate a move and then pick up the counters and move them!
I should think that there is commercial machine vision or photoshop kit that will do this job too.
Everyone of these steps has multiple solutions and is easier said than done!
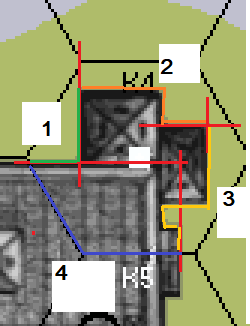
Consider the line from the centre of C4 to E5 on board
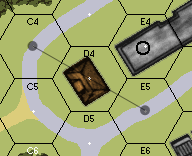
Convert hex coordinates to generate xy screen pixel coordinates for the hex centres.
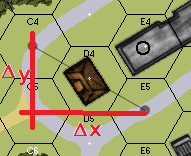
Use these coordinates to obtain the xy equation of the line joining C4 to E5.
Use the longest side of the right angled triangle to find the increment to scan along the line C4-E5 in screen pixels. Use as many increments as pixels on the longest side to ensure that edge detection occurs.
Use your programming language to retrieve the pixel values for the scan along the line. Represent this either graphically or as a table.
I convert these to a product value R*G*B/(255*255*255)
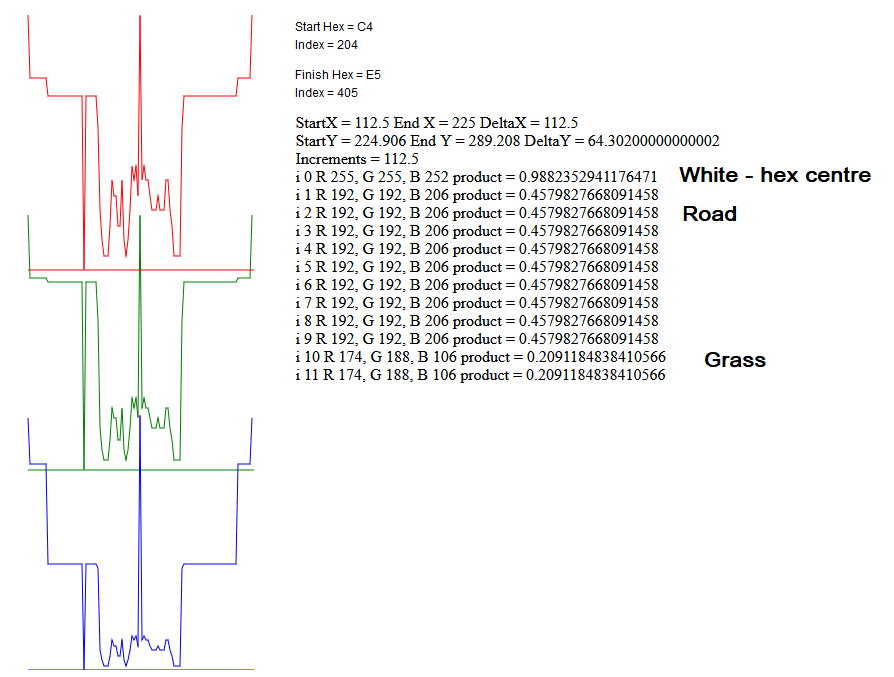
Hex centres are white - product very close to 1
Roads are grey - 0.456.
Grass is green - 0.209
All LOS obstacles have lower product values than grass but only hex boundaries and labels (E4 etc) have product 0.
With the building in D4 use a side scanning raster of pixels to move down the vertical pixel columns until the top edge of the obstacle is found. Repeat the process from the bottom to find the bottom edge of the obstacle.

Convert the edge detection events into an array for the coordinates of the top edge and an array for the bottom edge.
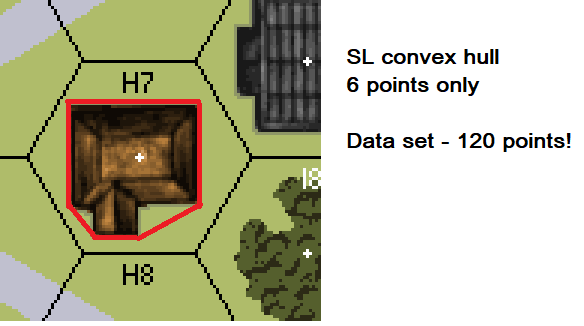
With massive computer power you could use these pixel arrays in LOS obstacle detection. The fact is that the building in D4 is a 4 cornered box. So we need to reduce the data set to a convex hull which encloses the outline of the building for SL LOS purposes.
There are probably a lot of ways to do this. I divided the edge arrays into 4 quadrants.
Then find the extremal points of the data set.
These are the points with minimum/maximum x and minimum and maximum y
These provide the basic points upon which to construct the convex hull. The convex hull cannot go beyond these points.
Now for the hard part as each quadrant works differently and screen y coordinates are upside down!
Working in quadrant 1 find the gradient (actually raw Δx, Δy values are safer) of the line joining the start of the quadrant
to the end of the quadrant. In quadrant 1 any point 'inside' the line joining start to end can be ignored. Any
point 'outside' the line must be added to the hull and it become a the new start for the line until the end is reached.
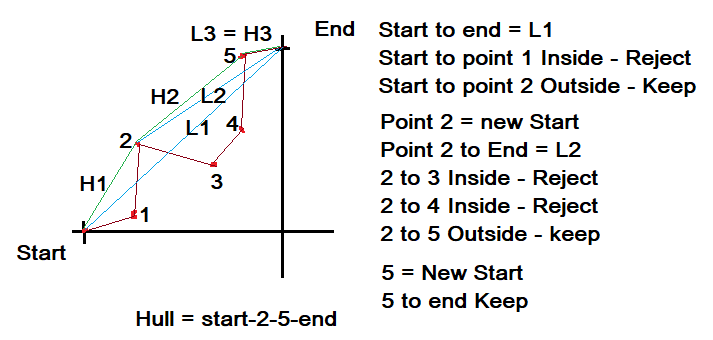
At the end of this process you have an array of xy coordinates which chart the SL LOS convex hull which surrounds the obstacle.
In practice internal boundaries of multi hex buildings and woods need a small spur adding to prevent shots through the building.
I then use the hull vertices to generate the hull edges which I then check against the LOS line.
To scan a map I usually do buildings, woods, hills, wheatfields etc. in order of increasing RGB product.