2d Graph Plotting
This page shows you how to convert Logo into a 2D chart recorder. It enables you to plot graphs in the xy plane with a colour representing a function of those coordinates.
The pictures and programs below show a few ideas. You can cut and paste the code into the editor window of MSWLogo
|
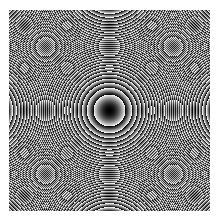
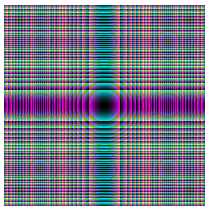
This program takes the (x,y) coordinates of the pixels on the screen. It squares them and finds their remainder when divided by 255. These values are then used to colour the pixels. In Logo this is a slow process. Java is much faster but much harder to program.
to squarem
ht
for [x -100 100 1] [
pu home rt 90 fd :x
lt 90 fd -100 pd
for [ y -100 100 1] [
make "tr :x*:x
make "rem remainder :tr 255
make "tr :y*:y
make "rem1 remainder :tr 255
make "tr :x*:x + :y*:y
make "rem2 remainder :tr 255
setpencolor (list :rem :rem1 :rem2) fd 1
]]
end
| 
 |
|
This program draws a basic version of the Mandelbrot set. Again Java is much quicker (well nigh essential if you want to really study this kind of fractal) but there is an arcane satisfaction to be had from getting good old Logo to do it!
to mbrot
ht
penpaint
for [x -100 100 1] [
for [ y -100 100 1] [
make "x0 :x/50
make "y0 :y/50
make "cx :x0
make "cy :y0
pu home fd :y rt 90 fd :x pd
make "count 0
make "mod :x0*:x0+:y0*:y0
while [:mod<4] [
make "xn :x0*:x0-:y0*:y0+:cx
make "yn :x0*:y0*2+:cy
make "x0 :xn
make "y0 :yn
make "mod :x0*:x0+:y0*:y0
make "count :count+1
if :count > 10 [ make "mod 20]
]
make "count :count*25
setpencolor (list :count :count :count) fd 1
]]
end
|
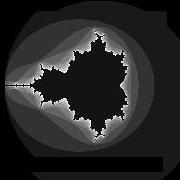
The Mandelbrot set is a mapping of the complex plane. The x coordinate represents the real part of the complex number z=x+yi and the y coordinate represents the imaginary part.
i is the square root of -1.
The mapping used is z - z2+c where z and c are both complex numbers. This mapping either heads for a fixed value of magnitude less than 2 or grows to infinite size. The colours on the image indicate how big the iterated number z gets.
To generate the Mandelbrot set z is initially set to 0 and c is of the form x+yi giving the (x,y) coordinates of a point on the complex plane. The program then maps z as z2+c and colours the initial c value accordingly.
When z is squared the following results for z=a+bi
z2=a2+2abi-b2 (as i2=-1)
This has a real part equal to a2-b2
and an imaginary part equal to 2abi
The start value of c is added to this and the process repeats. In other words the mapping can also be thought of as
x goes to a2-b2+x
y goes to 2ab+y
Where (x,y) is the starting value of c and provides the initial values of a & b respectively.
|